JAVA visualvm is a nice in house tool from java to monitor and debug performance issues.
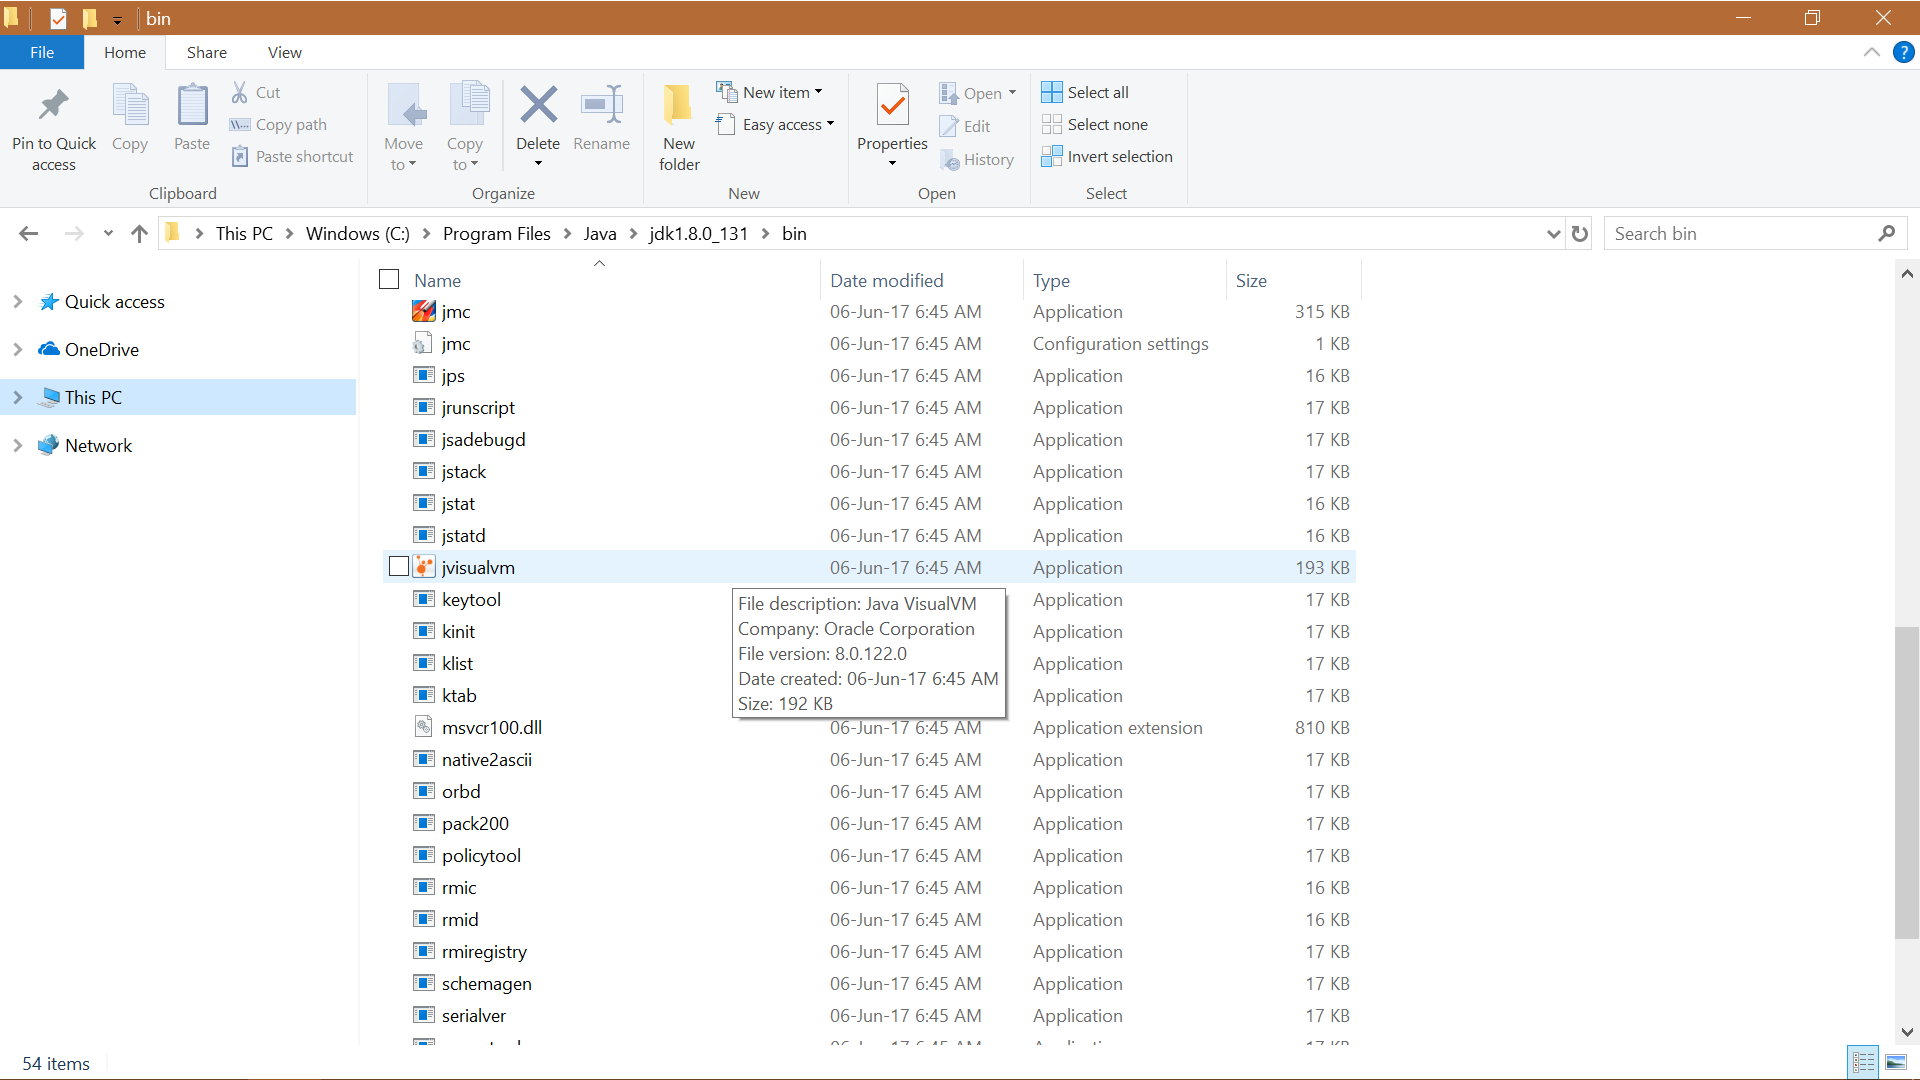
You can find it at location - C:\Program Files\Java\jdk1.8.0_131\bin\jvisualvm.exe
Yes thats right its inside the JAVA folder.

As shown in the below pic , go to the Local section and click on the process related pid
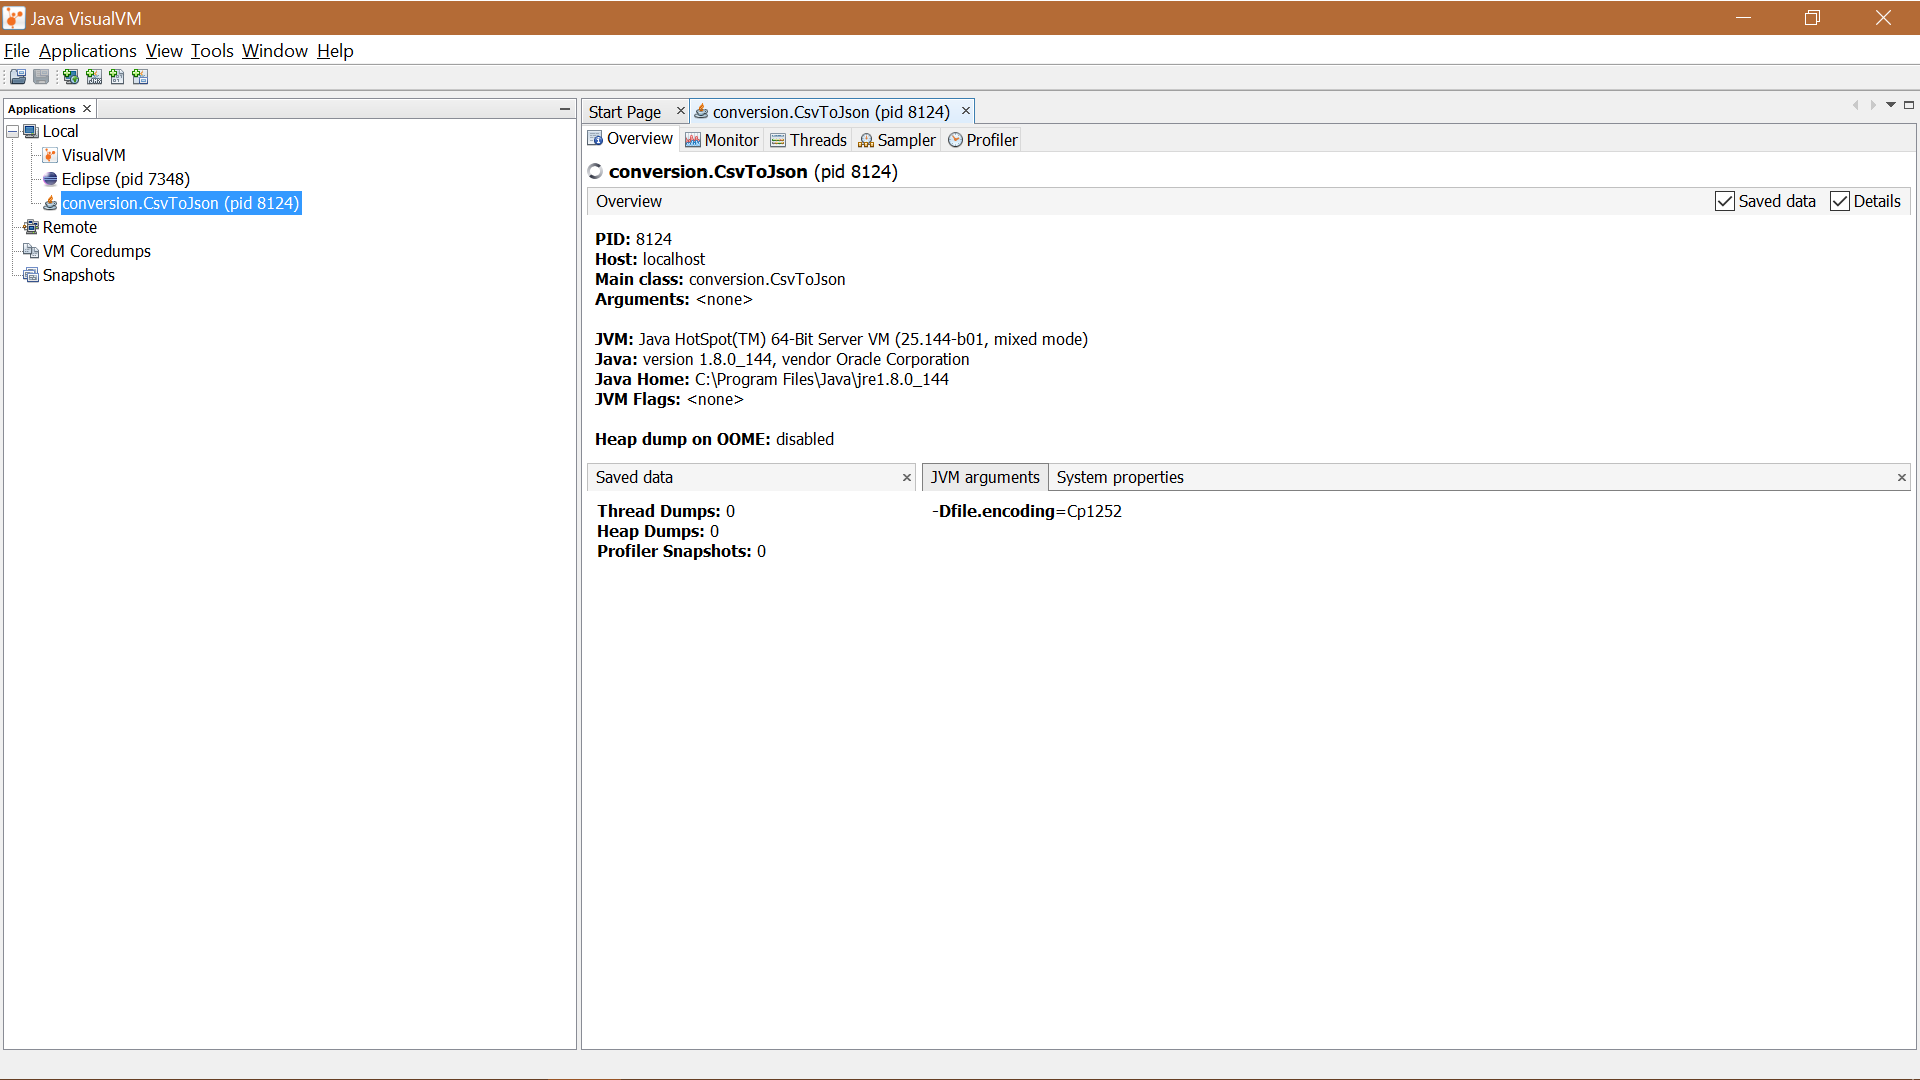
After you click on the pid , in the right section against the pid you would be able to see several tabs
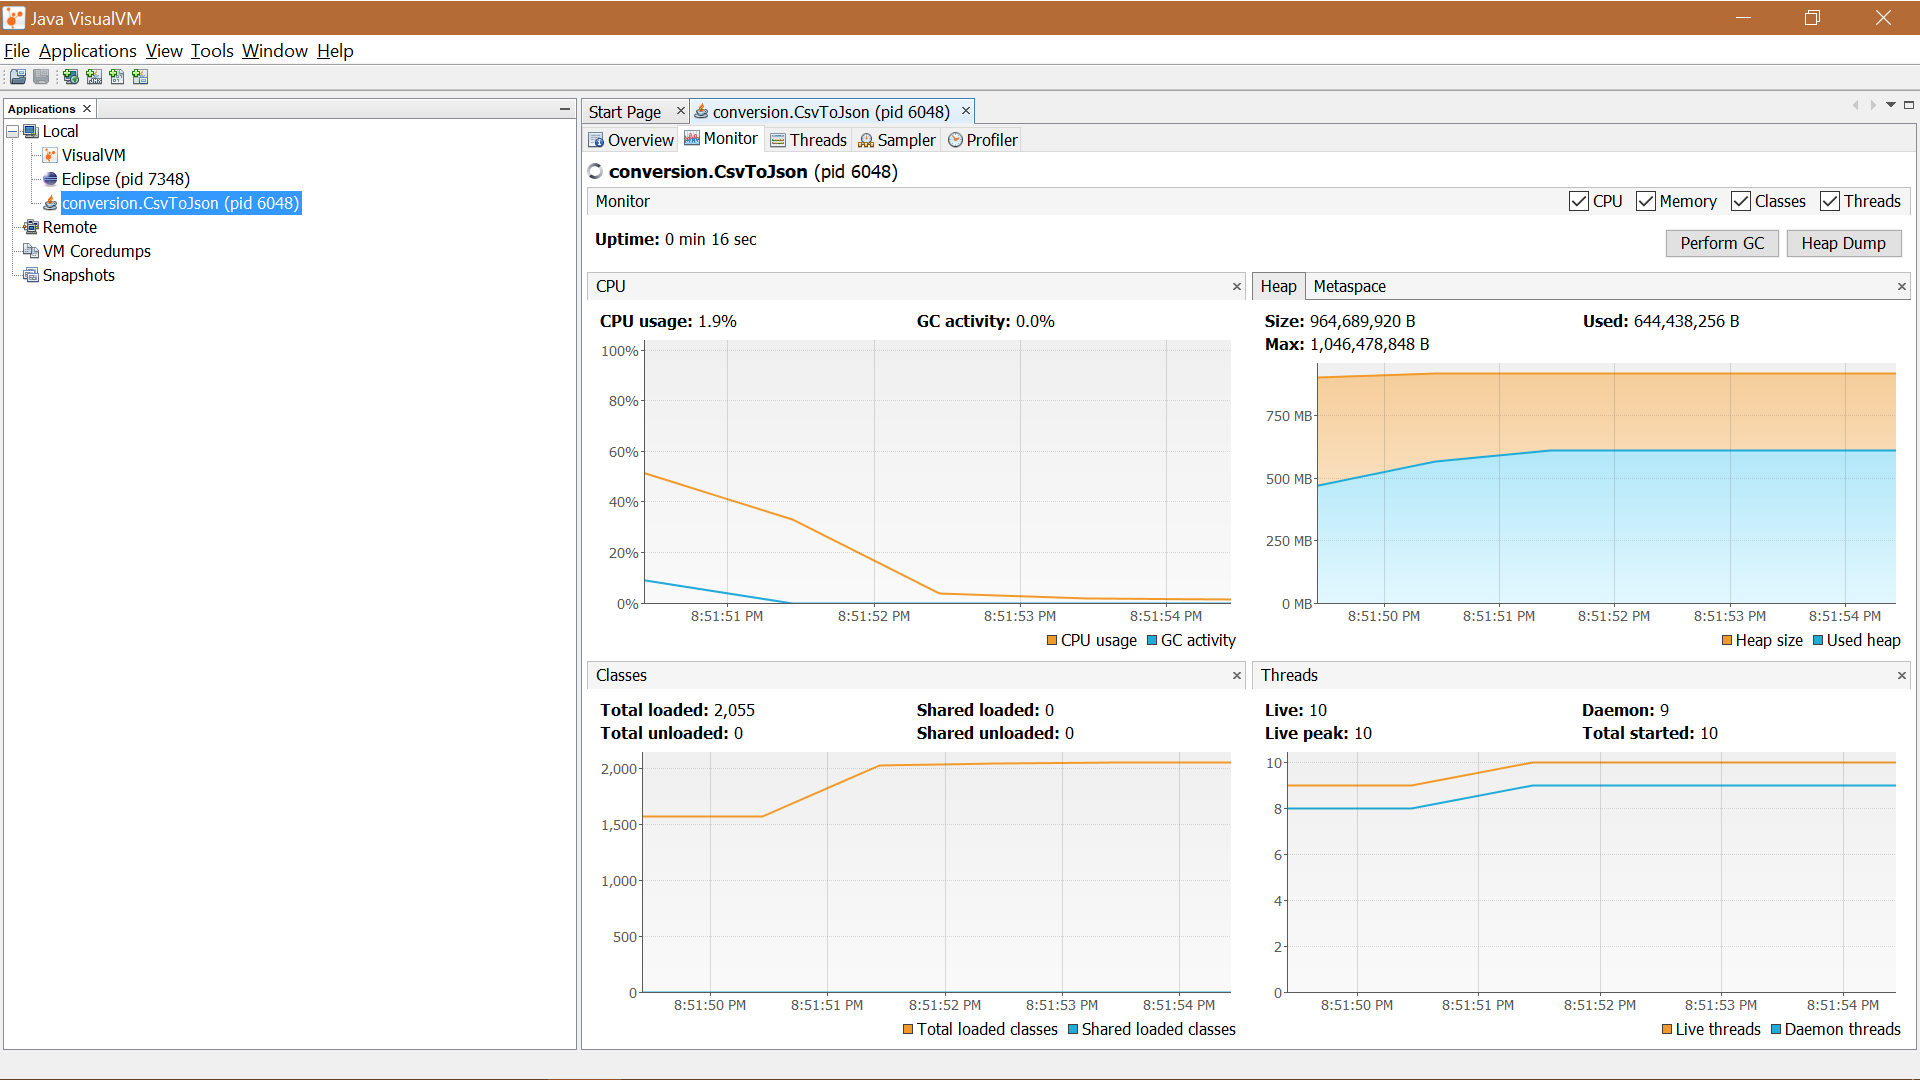
Select the monitor tab to monitor GC
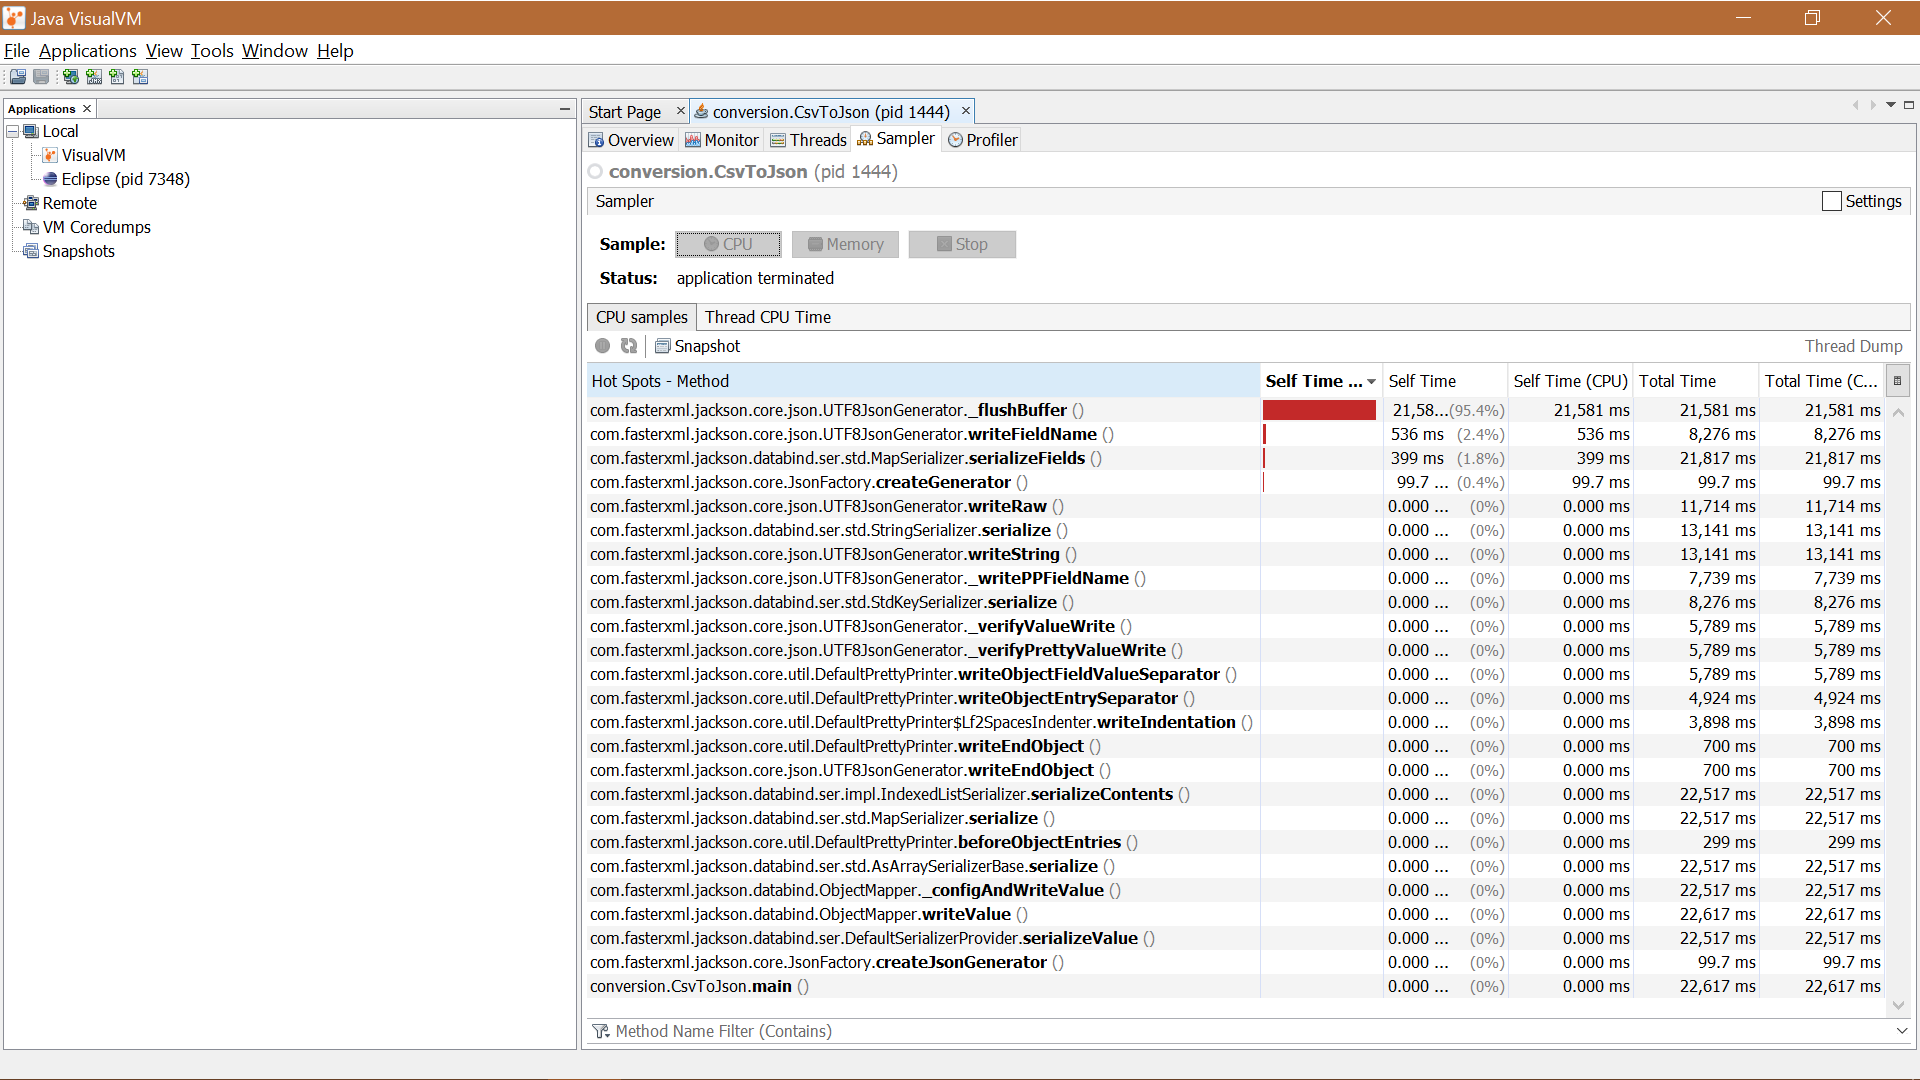
After you click the sampler tab , you need to select between cpu sampling or memory
Once you do the above task , then you can see the CPU or memory consumption of each method
